We at Adcloud Dev have started using Trello for our Sprint planning. Trello is a simple task management tool mimicking physical boards with columns known from Kanban boards. We especially like that it looks like our physical board. (Why we keep two boards? That's a topic for different blog post.)
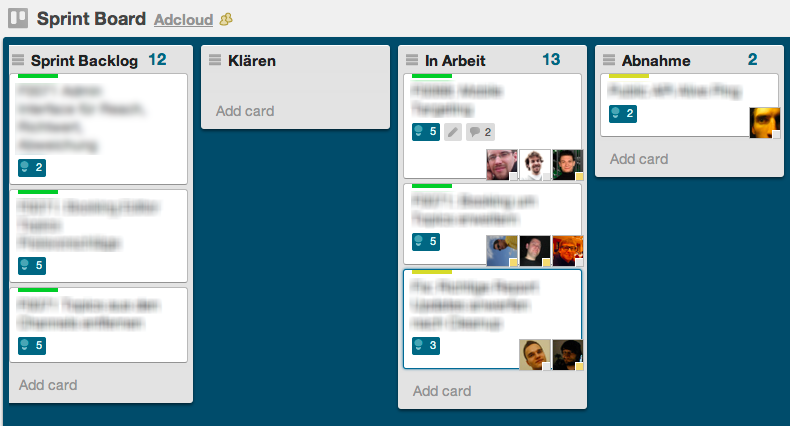
Now Trello doesn't come with a notion of card types (for bugs and user stories) or points per card (for estimating and tracking), but its a web application and it has an API. Hooray!
For the different card types we are using the Trello labels and a convention: Red=Bug, Yellow=Chore, Green=Feature. Our Sprint commitment goes only for features and chores but we also want to track bugs.
For the estimation we use a another convention: Put the points into simple brackets into the name of the card. E.g.: "Writing Blogpost (2)". The great thing is that there is already a Chrome Extension Trello Scrum that extends Trello to assist you entering and reading these points!
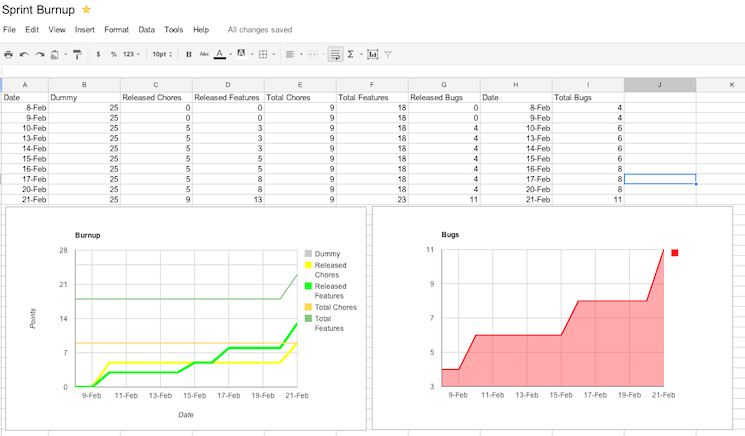
Now there is one small piece left: How do you do your burndown chart? Well it turns out that Trello has an awesome API. It can fetch all the lists and cards from the board. And with the naming convention we can simply define our work in progress and our work done, grab it from Trello and put it into a chart. Since we are using Google Apps a lot and since they have their own scripting environment Google Apps Script we simple wrote a script and pull the data into a spreadsheet. In that spreadsheet is an embedded chart and via a trigger the data is fetched every morning.
Unfortunately it's not easy to share and test Google Apps Script. I might work on that in the future. For now you can use the following script as a starting point. Just create a new spreadsheet. Open Tools > Script Editor and paste the script into it. Change the variables and give it a try.